
Data Analysis and Decision Making
Foundations of Business Online Program
PROGRAM DETAILS
Start Dates: Enroll Immediately
Duration: 50 hours of content
Format: 100% Online
Tuition: $299
Program Description
With the growing need to be knowledgeable and skilled in the area of data in the modern business environment, it is no surprise that you would choose this course. Many businesses are focusing on machine learning and big data. It is ideal to develop a good foundation in data analysis to weigh in intelligently on these discussions. By the end of this class, you will be prepared to operate successfully in this context. The first area we will tackle is probability, which involves measuring uncertainty and determining the best business decision. This can be achieved with descriptive statistics and data visualizations. This will be followed by an introduction to using Palisade StatTools, which will be a recurring option throughout the course.
Next, you will learn how to form a confidence interval of estimation and how to perform common statistical tests to compare means and proportions. You will get the chance to practice these tests on different problem sets. We then dig into the foundations of linear regression. In the business context, many use this as a predictive model for decision-making. No matter what field of business you are involved in, you will find this course to be very relevant to your business ventures, decisions, and data challenges.
Why take this course?
As this course is quantitative, we aim to give you as much practice as possible. We typically start by introducing you to concepts that you need to understand, followed by the equations. We then demonstrate very concrete examples of how to solve case-based problems before asking you to try some problems on your own. You will also have access to bonus content demonstrating how to solve some of the practice problems you complete.
By the end of this course you will be able to:
- Analyze the role of uncertainty and risk in the decision-making process
- Analyze available data to understand relationships among variables and to create predictions
- Use available computing technology (e.g., spreadsheets) interpret make inferences about underlying populations
- Turn raw data into insight and actionable information
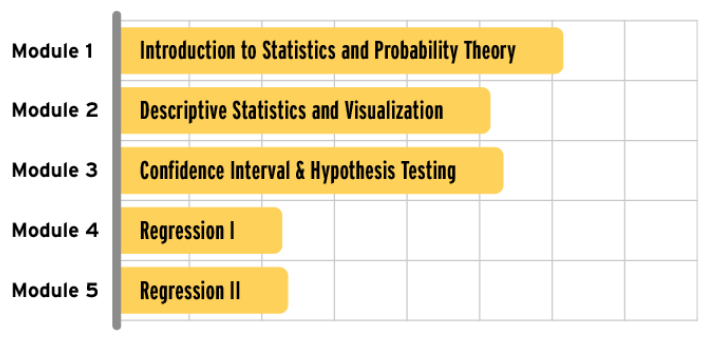
Course Topics
In this module, we will discuss probability, which is fundamentally important in all aspects of business. You may think that you are new to the concept of probability, but you actually make decisions based on probability every day. Any time you think to yourself, "What are the odds..." you are considering the probability that something will occur. In this module, we're going to talk about how to calculate probability more precisely so you can make better decisions based on those calculations.
This module will equip you to:
- Identify the sources and role of randomness in samples.
- Calculate expected value and variance of random variables and understand their significance in the context of business problems.
- Use Excel to make probability and percentile calculations.
In this module, we will discuss the concept of descriptive statistics and what they are used for. We will also talk about data visualizations and how they can be used to communicate the meaning behind data.
This module will equip you to:
- Generate and interpret key statistics and graphs to make sense of business data.
- Create cross-tabulations (pivot charts) in Excel.
- Add trend lines to scatter plots to estimate relationships between variables.
- Generate a variety of graphs using the Tableau tool.
In this module, we will discuss the concept of sampling distribution and construct confidence interval estimation for the means and proportions. Then we will examine how to use hypothesis testing to make statistical inferences on a population parameter.
This module will equip you to:
- Apply the concept of sampling distribution to understand confidence interval.
- Generate and interpret confidence intervals.
- Apply confidence intervals to generate business insights.
- Apply the Central Limit Theorem.
- Formulate hypothesis tests and evaluate p-values.
- Perform statistical tests on means and proportions.
- Perform statistical tests on correlations.
In this module, you will explore linear regression, one of the most widely used prediction methods.
This module will equip you to:
- Identify both simple and multiple linear regression models.
- Fit linear regression models to given data sets and determine which regression line best fits the data.
- Build and evaluate complex linear regression models using both numerical and categorical variables.
- Interpret the output of regression models and to use them for prediction.
In this module, we take a deeper dive into linear regression. We will expand the regression analysis we started in the previous module by looking at the purpose of our regression modeling. Is it an explanation or prediction and how that may affect our modeling decisions? We will discuss multiple other topics, including p-values, outliers, residual plots, multicollinearity, and lurking variables.
This module will equip you to:
- Identify how the goal of analysis will influence modeling decisions and how models are evaluated.
- Analyze large datasets with an awareness of error measures, p-values, and multicollinearity.
- Identify outliers and lurking variables.
- Apply variable selections to complex linear regression models.
Format & Structure
The course is completely self-paced. It will take you approximately 50 hours to complete all five modules. Activities include video lessons, readings, and self-reflection activities. Upon completing this course, you will receive a certificate of completion:
This is an asynchronous, self-paced course. That means that you can work at your own speed. There are review questions after most videos and reading. These questions are ungraded and designed for you to check your understanding of the content before moving on.
Smith Faculty

PK Kannan

Margrét Bjarnadóttir


Lingling Zhang